Visualizing integrations from the EA repository
By Mark Hissink Muller
One of the challenges for a digital organization is building and maintaining a clear overview of all its integrations.
Traditionally, this was the responsibility of the integration team. However, with the rise of cyber threats and resilience demands like DORA and NIS2, Enterprise Architects are playing a bigger role. Organizing the digital landscape is now crucial - and it’s not limited to organizations classified as critical infrastructure.
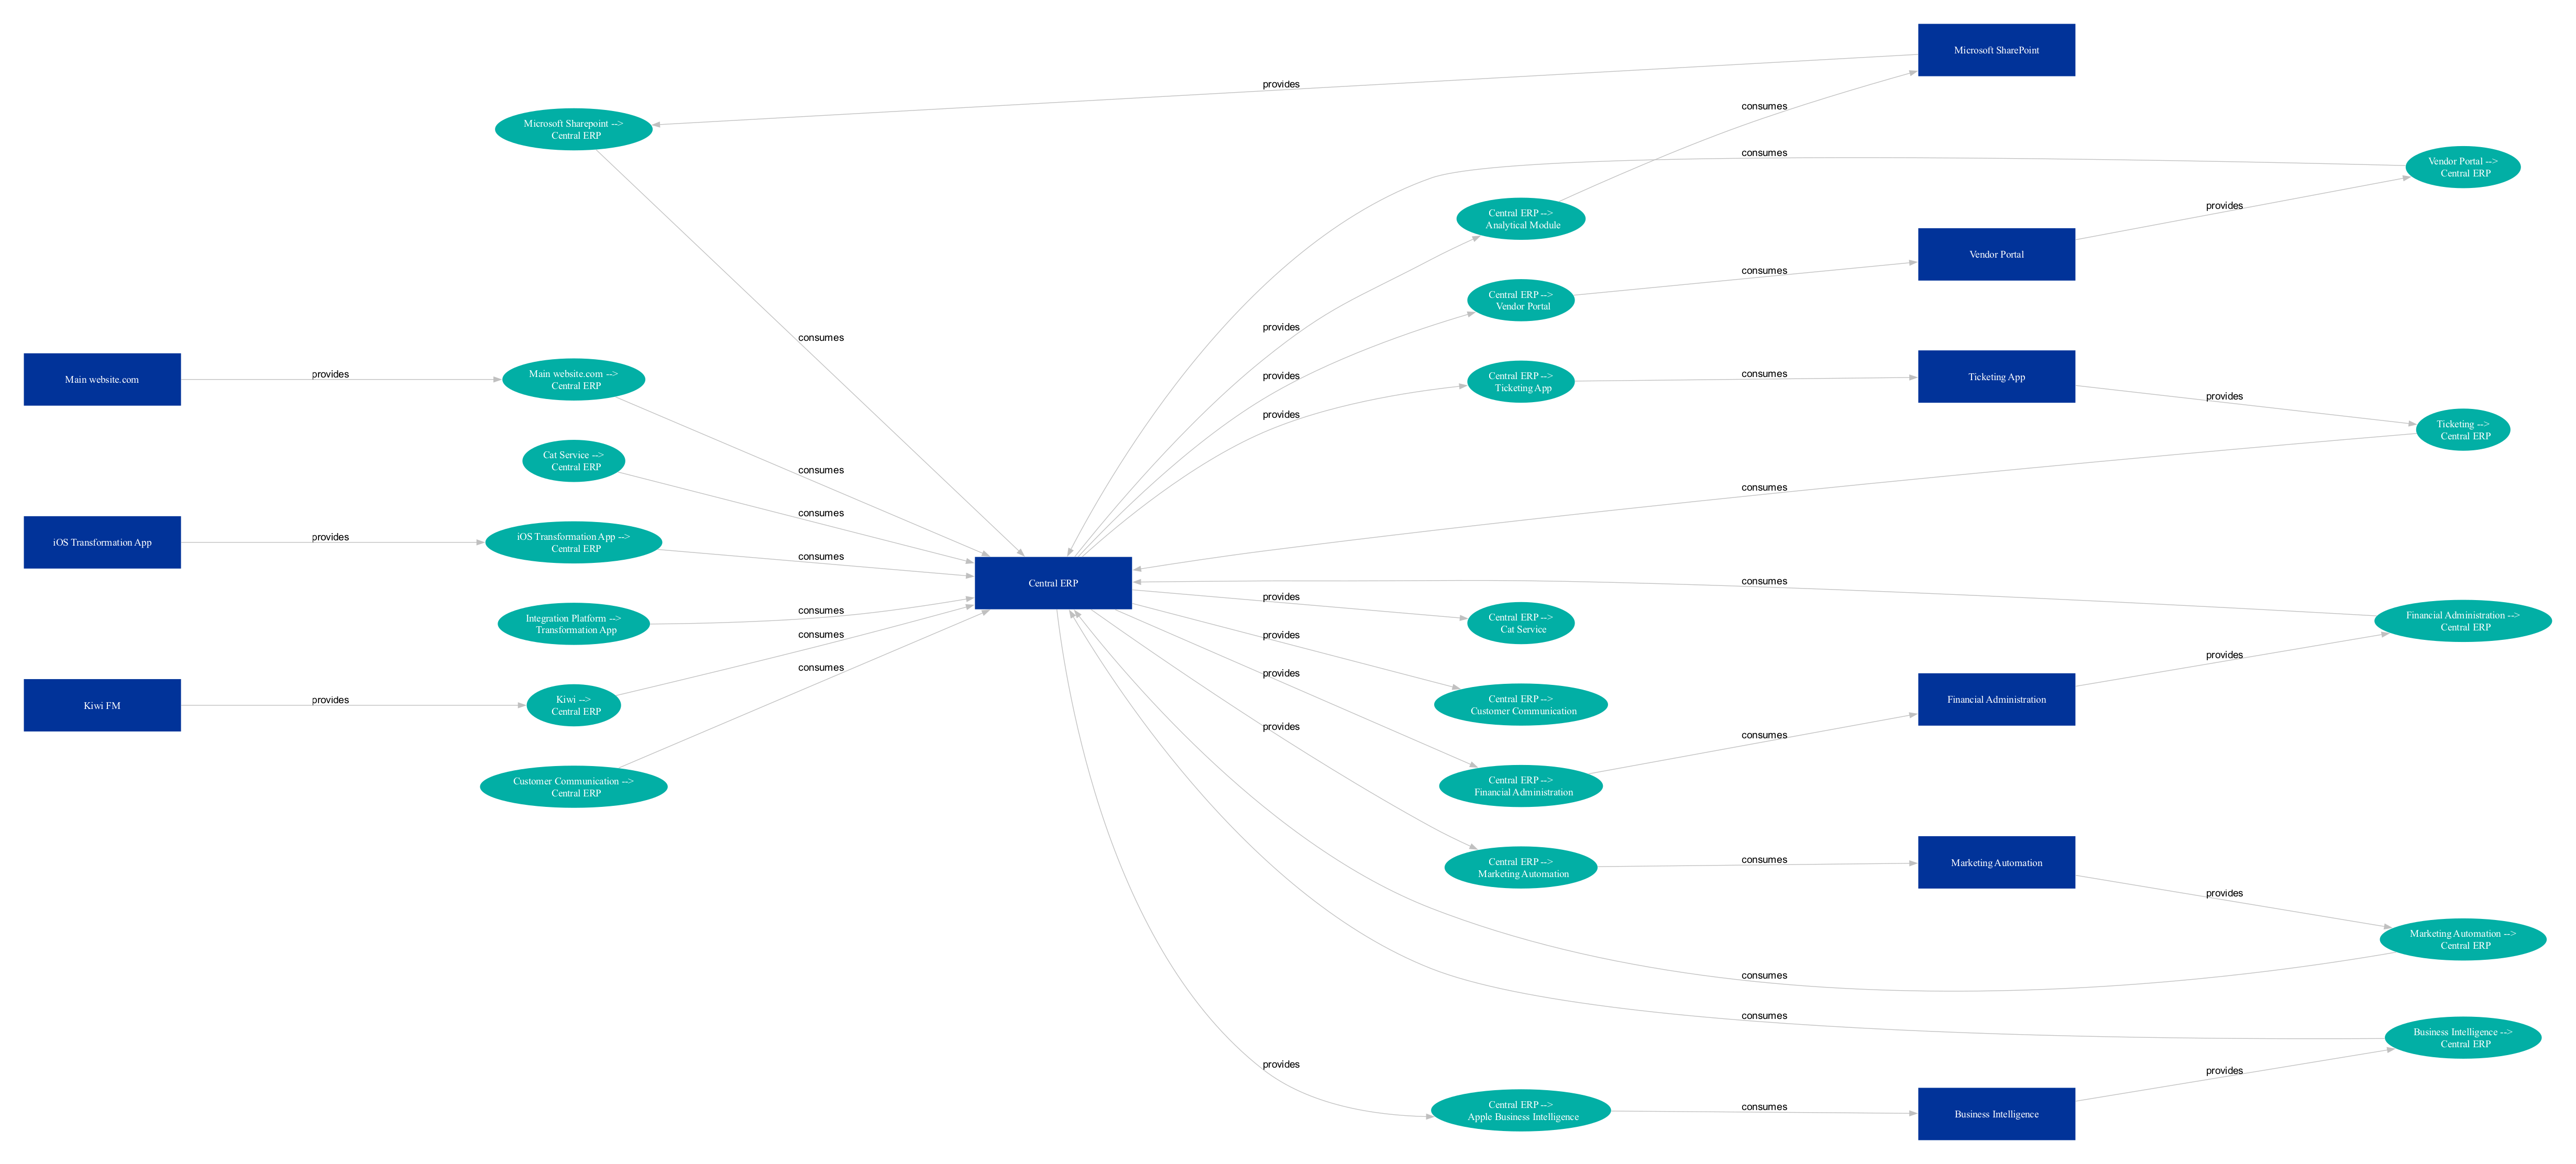
A data-driven approach to Enterprise Architecture (EA) can make a big difference. When your EA repository acts as a digital twin of your organization, it provides an accurate, documented representation of key elements, such as the business structure, applications, data objects, and integrations. This clarity makes it much easier to generate and maintain an overview of integrations. For example, here’s a generated integration map for one application, using sample data.

Ensuring your data is accurate does take effort, but the payoff is significant. The data becomes reusable for future EA use cases and business transformations.
Organizations typically document and enhance their EA repository over time, focusing on areas undergoing change. Measuring Enterprise Architecture supports this process, ensuring quality, alignment, and readiness for ongoing and future transformations.
Measuring Enterprise Architecture
https://MeasuringEA.net 🚀